Execution Profiling
Available for Flex (SSIS) only
Execution profiling expands your troubleshooting options by providing additional data about the execution of individual tasks inside your package. The information includes task execution times, task results, data flow row counts.
Usage
There are two ways to enable profiling for an execution:
Single profiled package execution
In most cases a manual profiled execution of a package will provide enough information to solve your problem. Open the page of the package you want to run. Expand the Run now menu at the bottom of the screen and select Run profiled. On the execution details page, the profiling data will be available right next to the execution log.

Configure a trigger for profiling
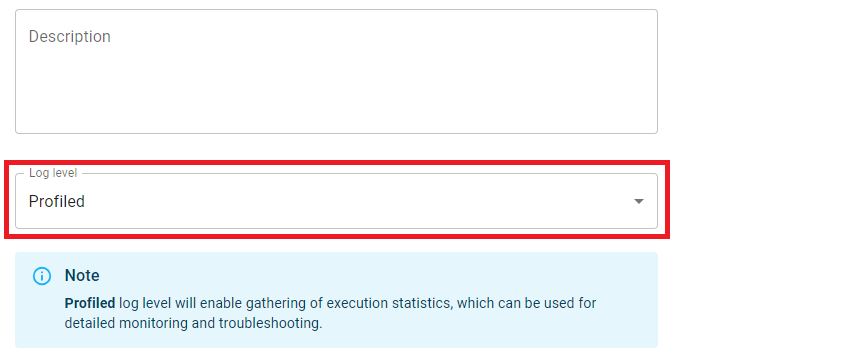
In more complicated scenarios you may want to profile all executions of a specific trigger (scheduled job, inbound webhook, post-execute action). Open the trigger page, select log level Profiled and save the trigger. All new executions of this trigger will have profiling enabled until you change the log level.

Profiling data
All profiling data is available on the Execution page next to the execution log. Like the execution log, profiling data can be observed live while the execution is running and also after it is completed.
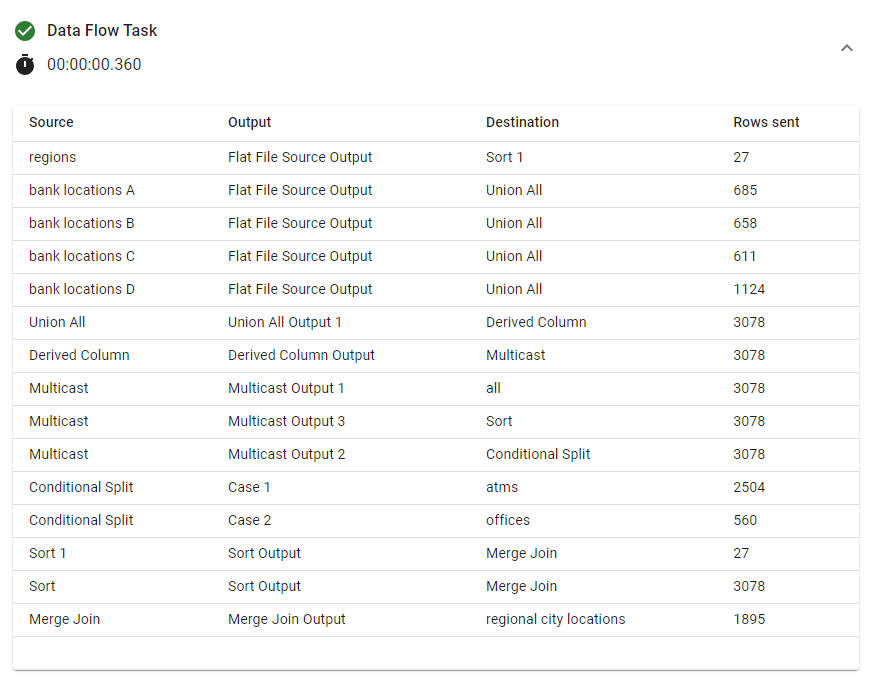
Each profiling item represents an executed task from your package. Repeated task executions inside a loop are represented as separate items. The task item displays execution time and indicates the task status (success or failure) with an icon in the top left corner. Additionally Data Flow Task items are expandable and contain data flow insights.
The data flow table displays a row for every transition between components in your data flow. Each row displays source component name, destination component name, source output name the destination is connected to together with the total number of rows passed between the two components.

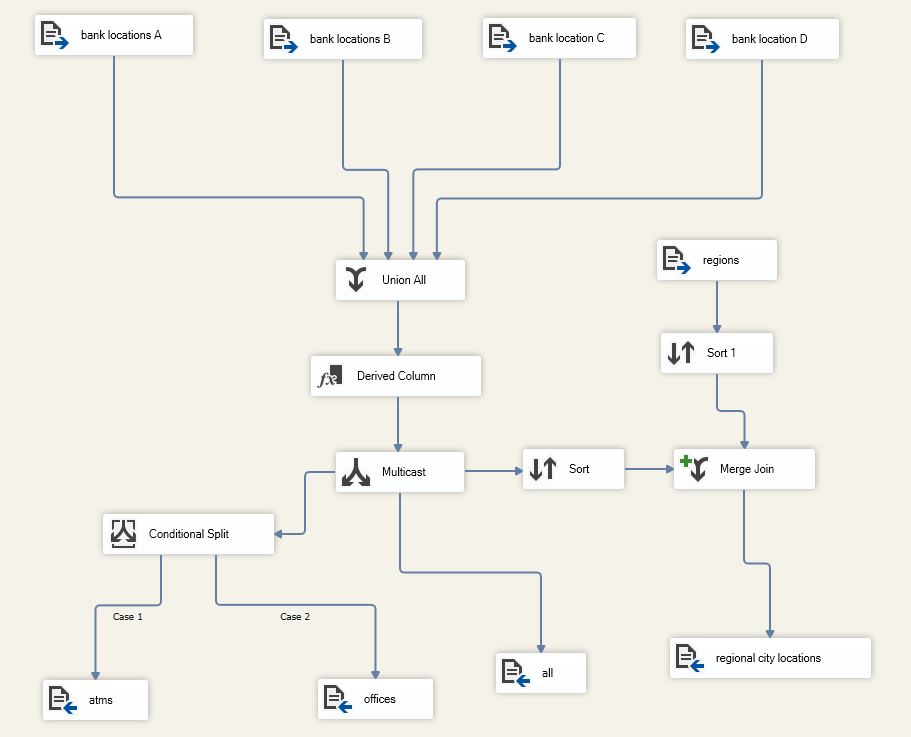
For reference here is the data flow that produced the profiling above:
